Ready to start improving processes?

✔ 14-day free trial      ✔ No credit card required      ✔ Start training immediately

logotype

sigmaxl

We offer a 1-year license to Minitab for $599. If this interests you, please contact us for more information. However, we recommend using SigmaXL (a

What’s A Scatter Plot? A Scatter Plot is a chart that shows the relationship between two variables (if any). A Scatter Plot is also known

What is a Run Chart? A Run chart is a graph that displays data in sequence over time. This kind of chart can display continuous or

What’s A Pareto Chart? A Pareto Chart is a quality chart of discrete data that helps identify the most significant types of defect occurrences. It

What’s a Histogram? Histograms are frequency charts. In Lean Six Sigma, they show the distribution of values produced by a process. In other words, a

Here are our top picks for Lean Six Sigma success stories and news from around the web for the week of April 11, 2016. Zacks

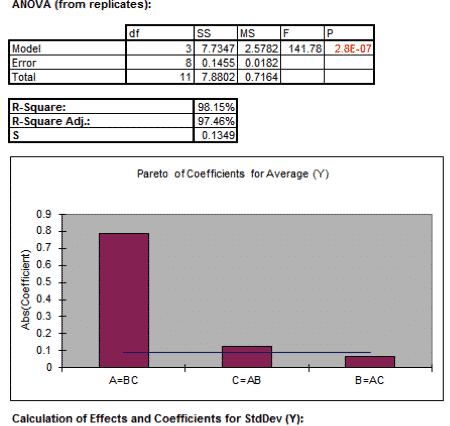
What’s Design Of Experiments – Full Factorial? DOE, or Design of Experiments is an active method of manipulating a process as opposed to passively observing a

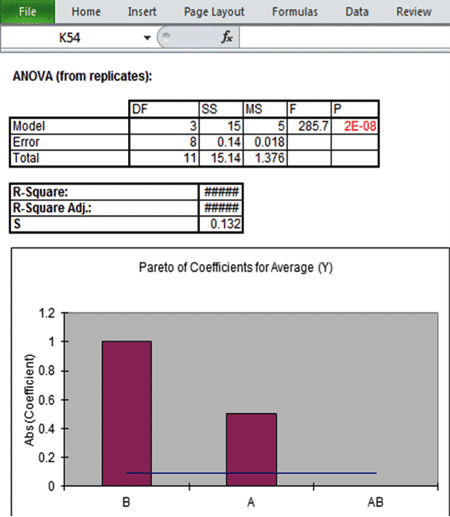
What’s Design Of Experiments – Two Factorial? DOE, or Design of Experiments is an active method of manipulating a process as opposed to passively observing

What’s Design Of Experiments (DOE) – One Factor At A Time (OFAT)? DOE, or Design of Experiments is an active method of manipulating a process

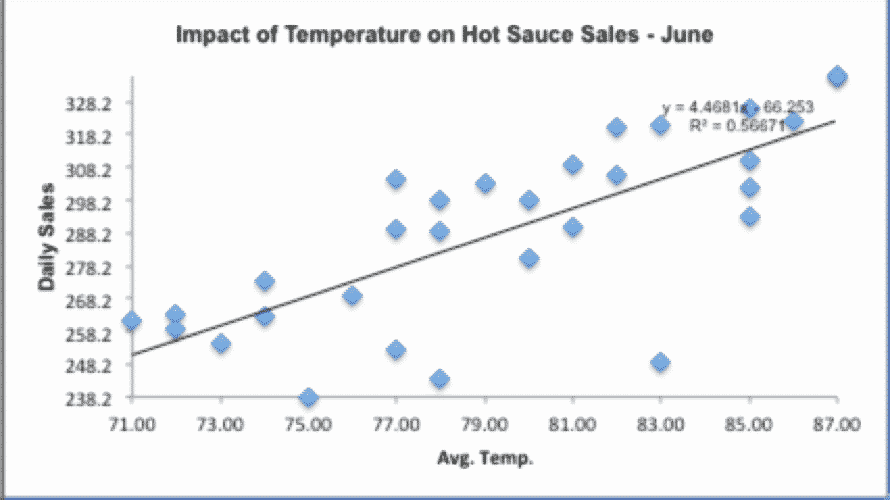
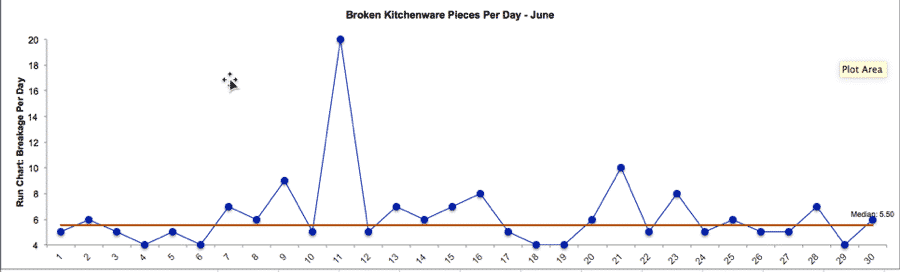
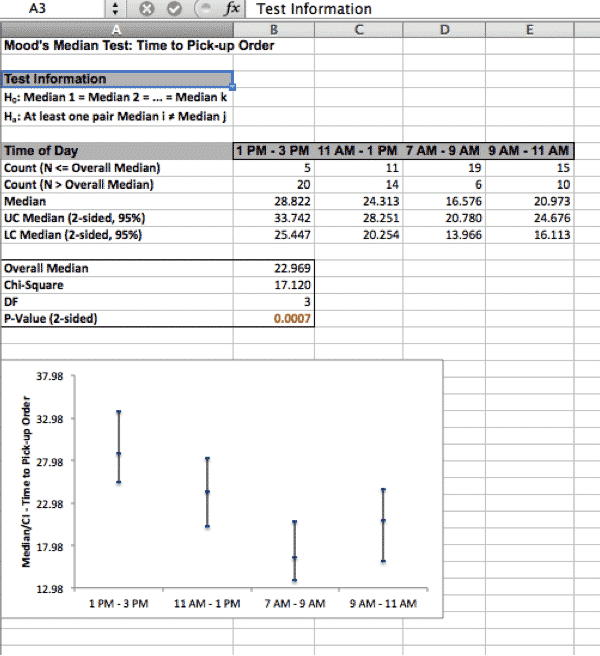
What’s A Mood’s Median Test? The Mood’s Median Test is a hypothesis test that determines whether a statistically significant difference exists between the medians of

No post found.