Lean Six Sigma Success Story: Project Summary The Challenge: Reducing Cost The Discovery: Data Visualization in the Hospitality Industry The Improvements: A simple presentation to the laundry
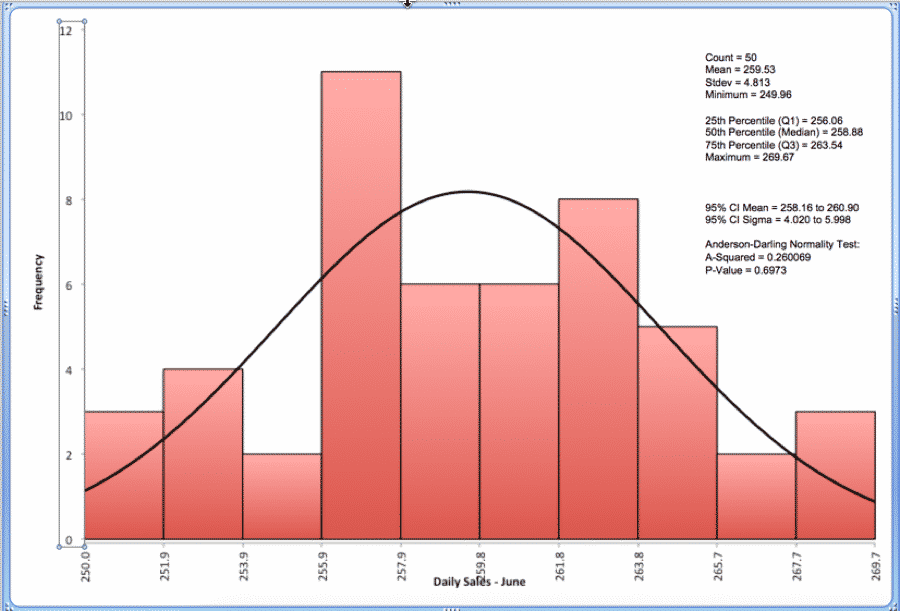
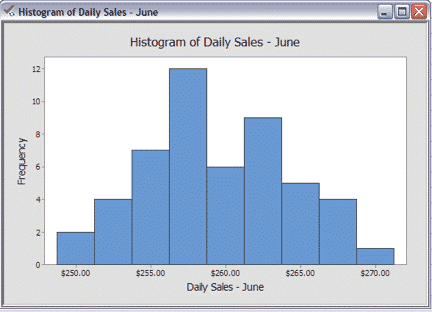
Histograms, also known as Frequency Plots, are a are visual displays of how much variation exists in a process. They highlight the center of the data measured as the mean, median and mode.