✔ 14-day free trial ✔ No credit card required ✔ Start training immediately
Annual Plan: $499 / year
Annual Plan: $17,499 / year($349.98/seat/year)Monthly Plan: $1,999 / month($39.98/seat/month)
Home » X-Bar & S Chart
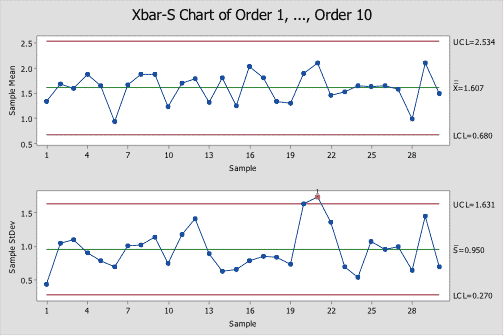
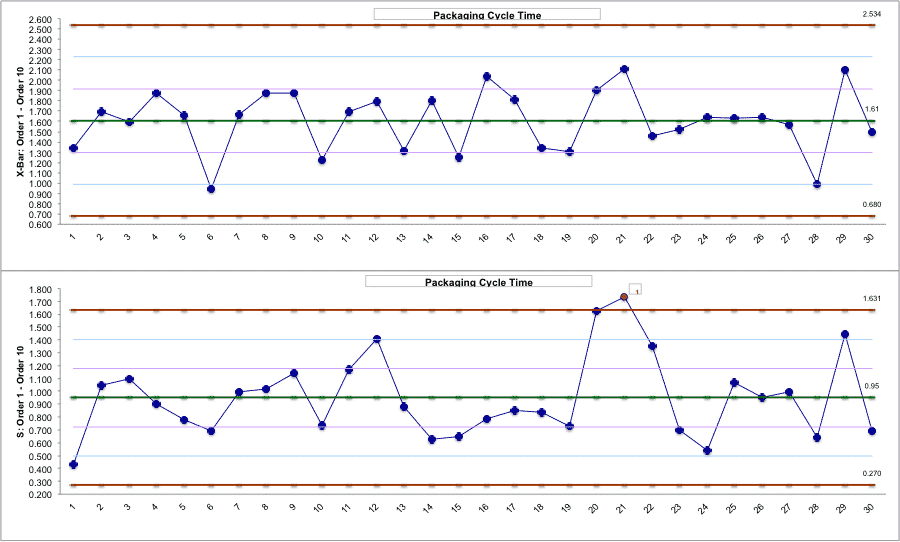
What’s A X-Bar & S Chart? X-Bar & S Charts are Control Charts designed for tracking the average of large subgroups of continuous data. They consist
No post found.