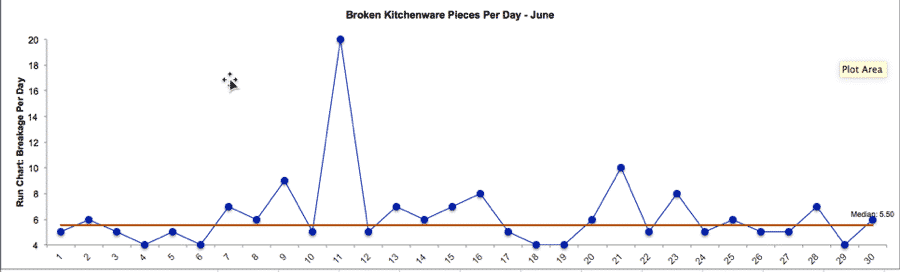
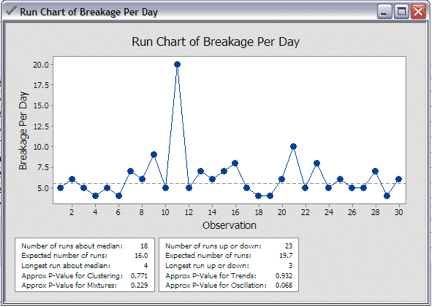
A Run Chart is a time series plot that displays shifts and trends in data over time. This kind of chart can display continuous or discrete data and generally appears with a median or average line.
Lean Six Sigma Success Story: Project Summary The Challenge: Reducing Cost The Discovery: Data Visualization in the Hospitality Industry The Improvements: A simple presentation to the laundry