Ready to start improving processes?

✔ 14-day free trial      ✔ No credit card required      ✔ Start training immediately

logotype

glossary

summary Summary Template Guides What is a Fishbone Diagram? A Fishbone Diagram is a structured brainstorming tool designed to assist improvement teams in coming up

summary Summary Template Infographics What is Failure Modes & Effects Analysis (FMEA)? Failure Modes & Effects Analysis (FMEA) is a risk management tool that identifies

A Value Stream Map displays the high level process steps along with key process data.
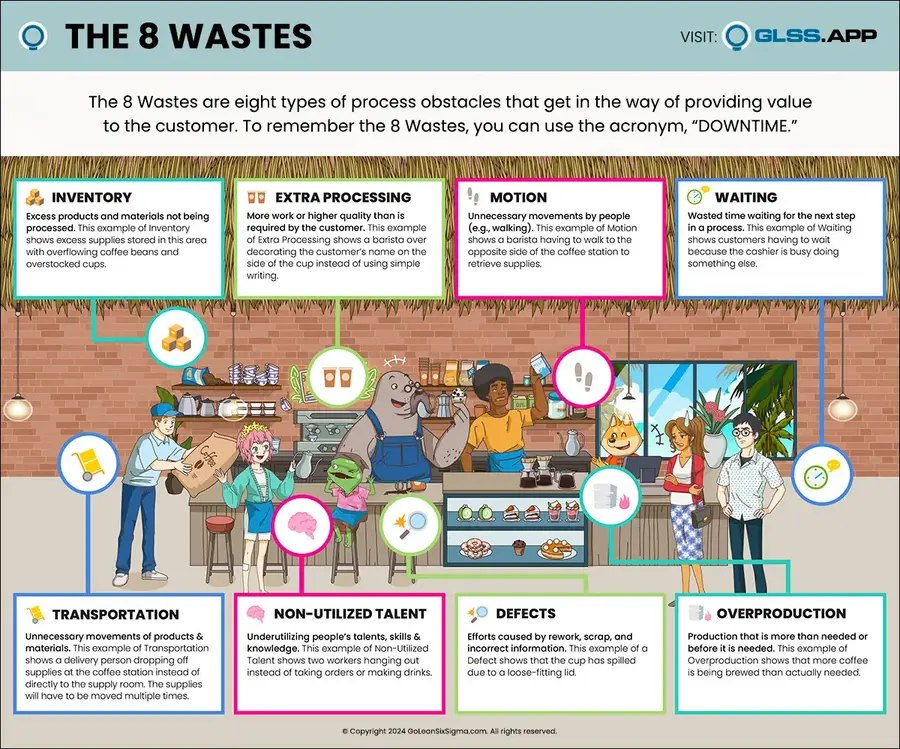
The 8 Wastes is a really interesting way of thinking about waste and exploring the problems in a system or process. It’s not just about cost-cutting, it’s about making the most impact with the resources you have, including the talent, materials, and time that go into a product or service.

summary Summary Template What is the Idea Funneling Guide? The Idea Funneling Guide is a targeted resource to help gather the best ideas to solve

summary Summary Template What is a Green Belt (with Project Completion) Course Pacing Schedule? One of the great advantages of remote learning is that it’s

summary Summary Template What is a Black Belt Course Pacing Schedule? One of the great advantages of remote learning is that it’s self-paced, but what

summary Summary Template What is a Green Belt Course Pacing Schedule? One of the great advantages of remote learning is that it’s self-paced, but what

summary Summary Template What is a Champion Course Pacing Schedule? One of the great advantages of remote learning is that it’s self-paced, but what should

summary Summary Template What is the A3 Coaching Kit? The A3 Coaching Kit is a series of tools to support A3 Users, A3 Coaches and

No post found.