What’s Design of Experiments – Two Factorial in Minitab?
DOE, or Design of Experiments is an active method of manipulating a process as opposed to passively observing a process. DOE enables operators to evaluate the changes occurring in the output (Y Response,) of a process while changing one or more inputs (X Factors).
Learn more about Design of Experiments – Two Factorial in Minitab in Improve Phase, Module 5.1.3. of Black Belt Training.
How to Run a Design of Experiments – Two Factorial in Minitab
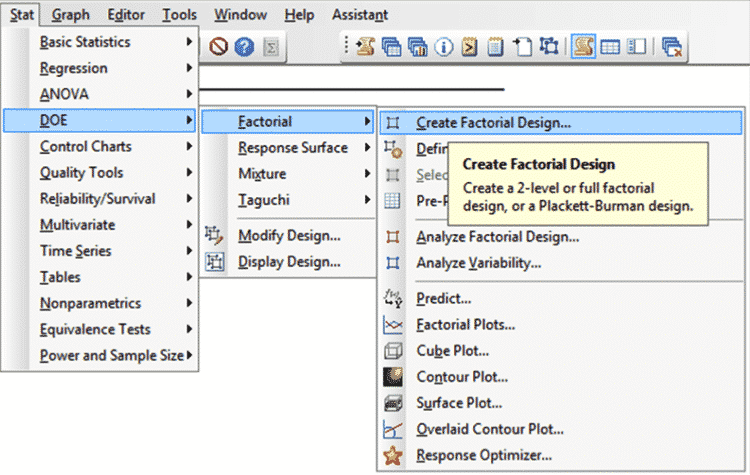
1. Create the Factorial Design by going to Stat > DOE > Factorial > Create Factorial Design:
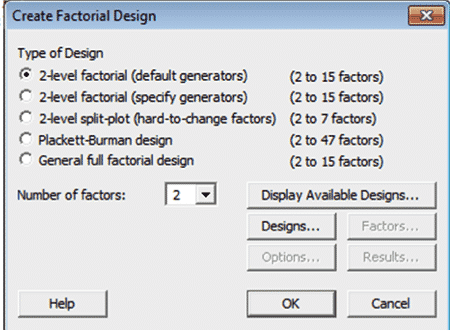
2. Next, ensure that [2-level factorial (default generator)] is selected
3. Input/Select [2] for the [Number of Factors]
4. Click on [Designs…]:
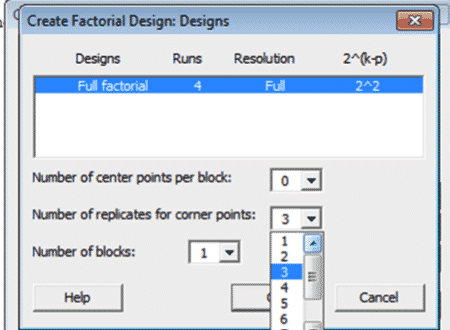
5. Ensure that [Full Factorial…] is highlighted
6. Input/Select [3] for [Number of replicates for corner points]
7. Click OK:
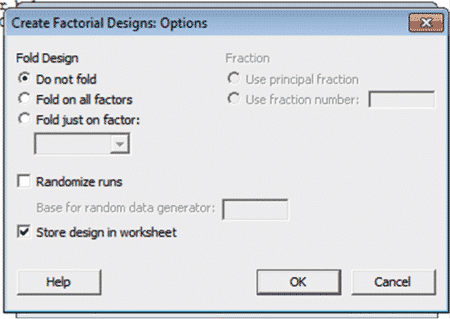
8. Select [Options] and uncheck [Randomize runs], make sure [Store design in worksheet is checked]
9. Click OK:
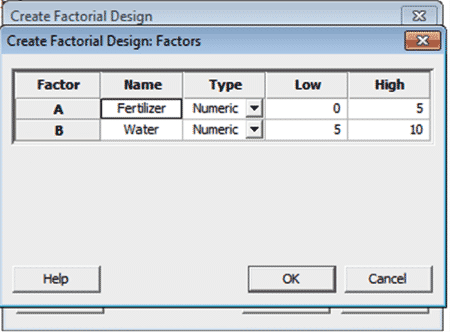
10. Select [Factors] and the dialog box below will show-up; load in the factor names and level settings
11. Click OK:
12. Minitab will create a worksheet containing the DOE array:
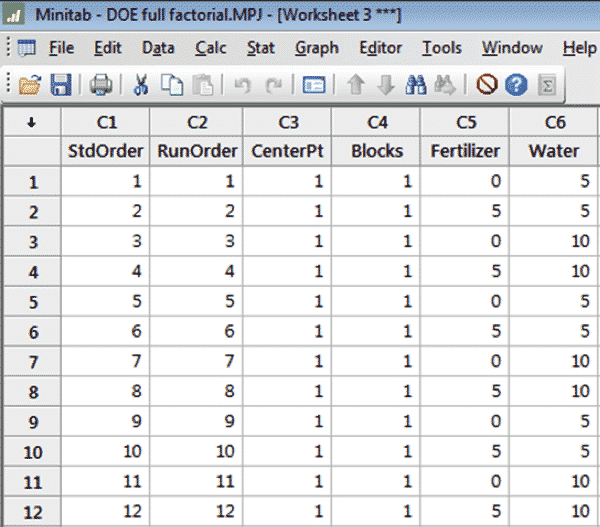
The first blank column in the worksheet (here C7) is reserved for the Response values
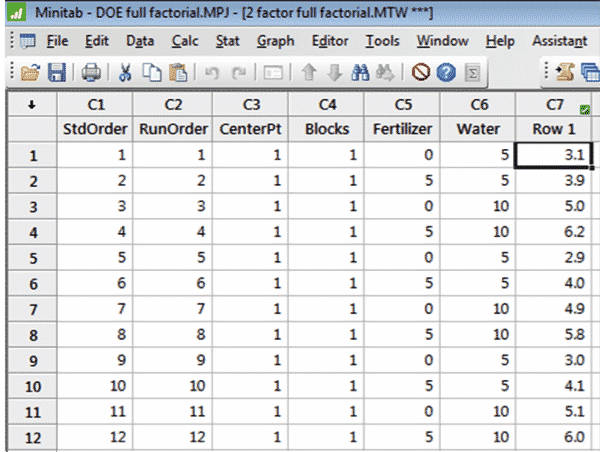
13. After running all of the experimental runs enter the results in to the worksheet:
The second series of steps allow us to analyze the results as well as produce the charts and graphs that help us communicate our results.
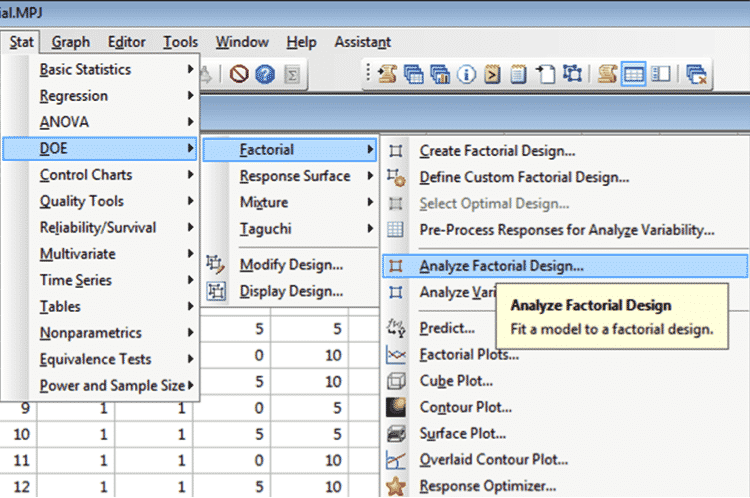
14. Go to Stat > DOE > Factorial > Analyze Factorial Design:
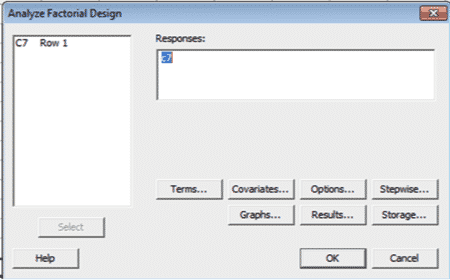
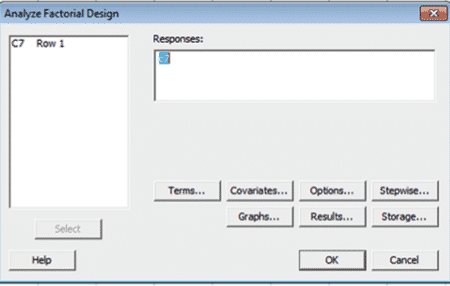
15. Enter the column (here C7) that contains the response in the open window called Responses (or just double-click on C7 in the left box)
16. Then click on [Terms…]:
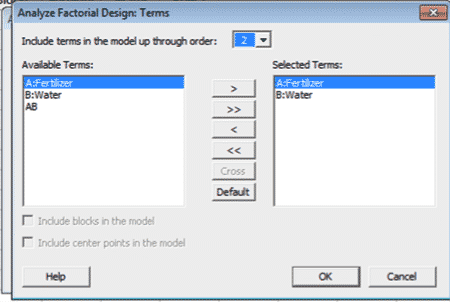
17. Select the terms you want in the model (in our case we want both factors; Fertilizer and Water)
18. Either double click on the term or use the [>] between the windows
19. Then click [OK]:
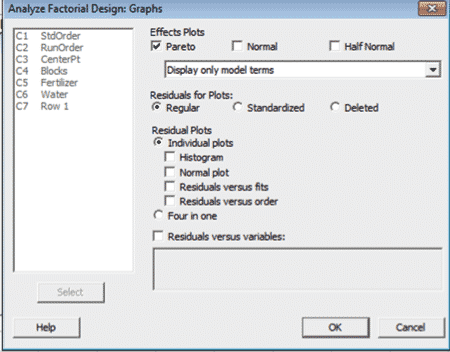
20. This time select [Graphs…]:
20. Select/Check [Pareto]
21. Click [OK]:
The following Pareto chart of the results is very effective in communicating the experimental outcomes:
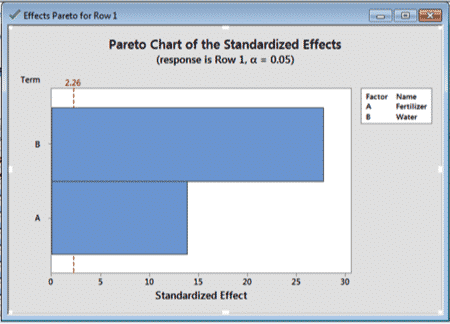
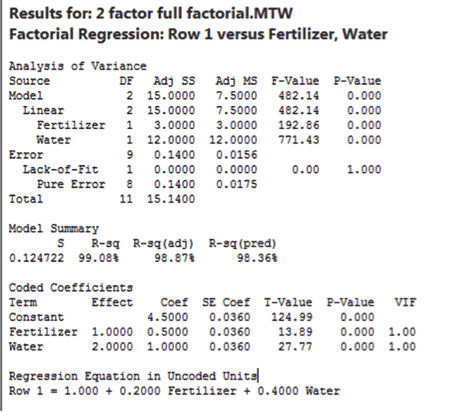
The details behind the analysis will be contained in the Minitab Worksheet.
This is the ANOVA table for the experiment.