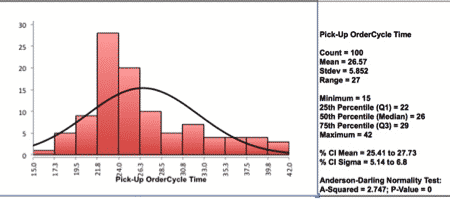
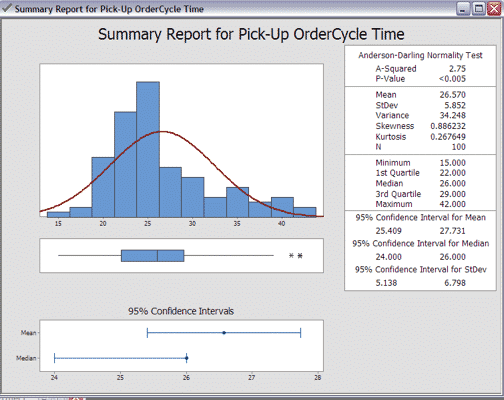
What’s a Normality Test (aka Anderson-Darling Test for Normality)? The Normality Test is a statistical test that determines whether or not a data set is
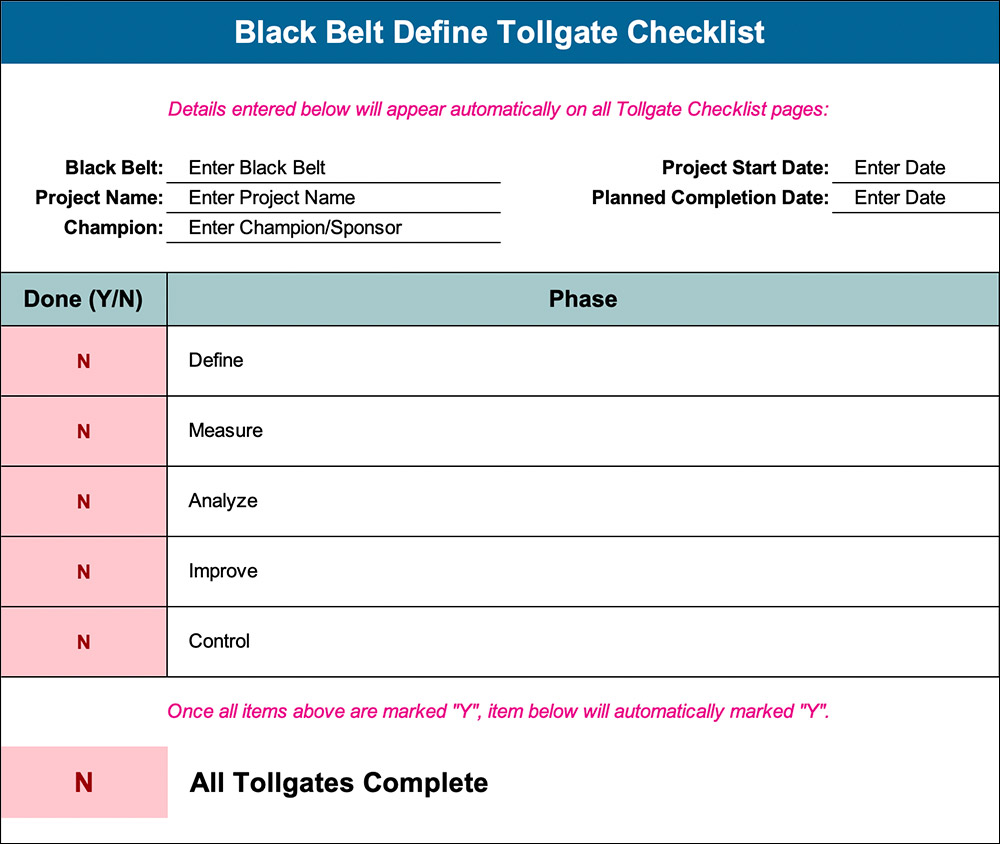
summary Summary Template What is a Black Belt Tollgate Checklist? The Black Belt Tollgate Checklists outlines the deliverables for each Phase of DMAIC. Each Phase
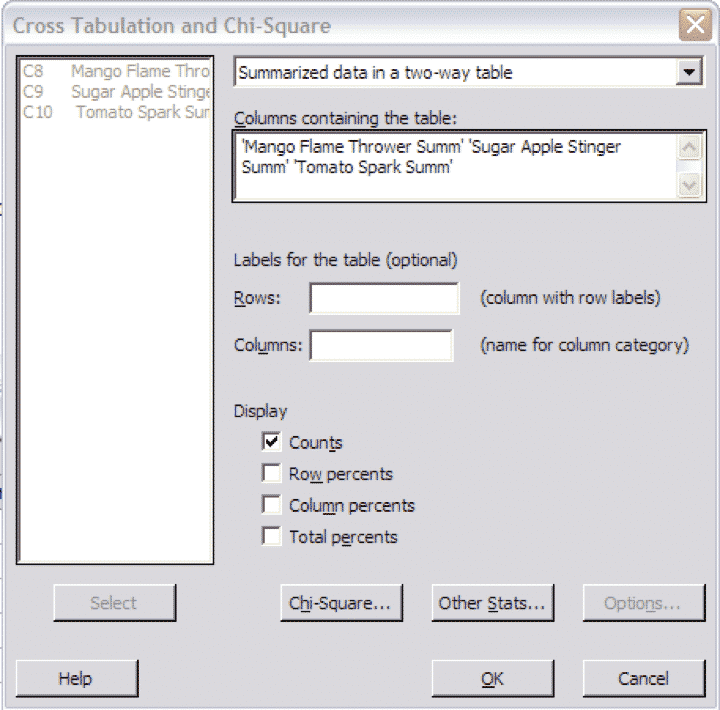
What’s A Chi-Square Test? The Chi-Square Test is a hypothesis test that determines whether a statistically significant difference (aka variance) exists between two or more independent
What’s A Chi-Square Test? The Chi-Square Test is a hypothesis test that determines whether a statistically significant difference (aka variance) exists between two or more independent
beta-wp.goleansixsigma.com is proud to collaborate with NAED to offer the highest rated, most practical and accessible Lean and Six Sigma courses to its Members. Yellow