GLSS
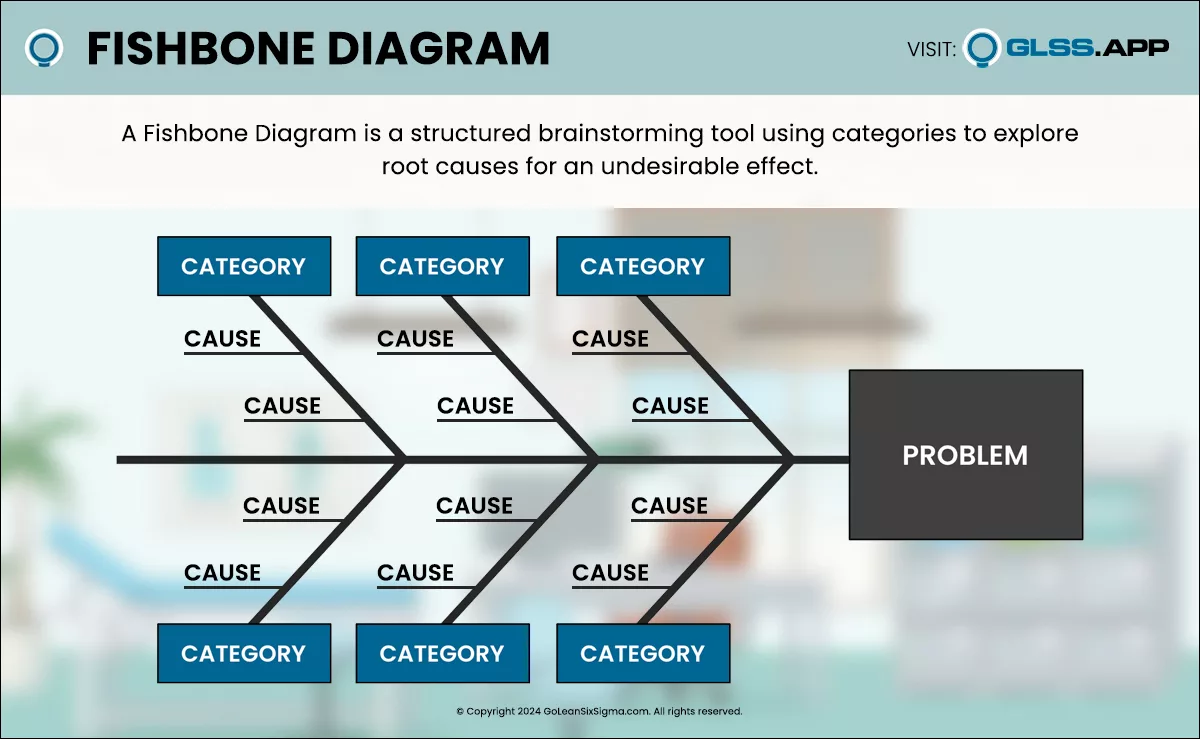
summary Summary Template Guides What is a Fishbone Diagram? A Fishbone Diagram is a structured brainstorming tool designed to assist improvement teams in coming up
summary Summary Template Infographics What is Failure Modes & Effects Analysis (FMEA)? Failure Modes & Effects Analysis (FMEA) is a risk management tool that identifies
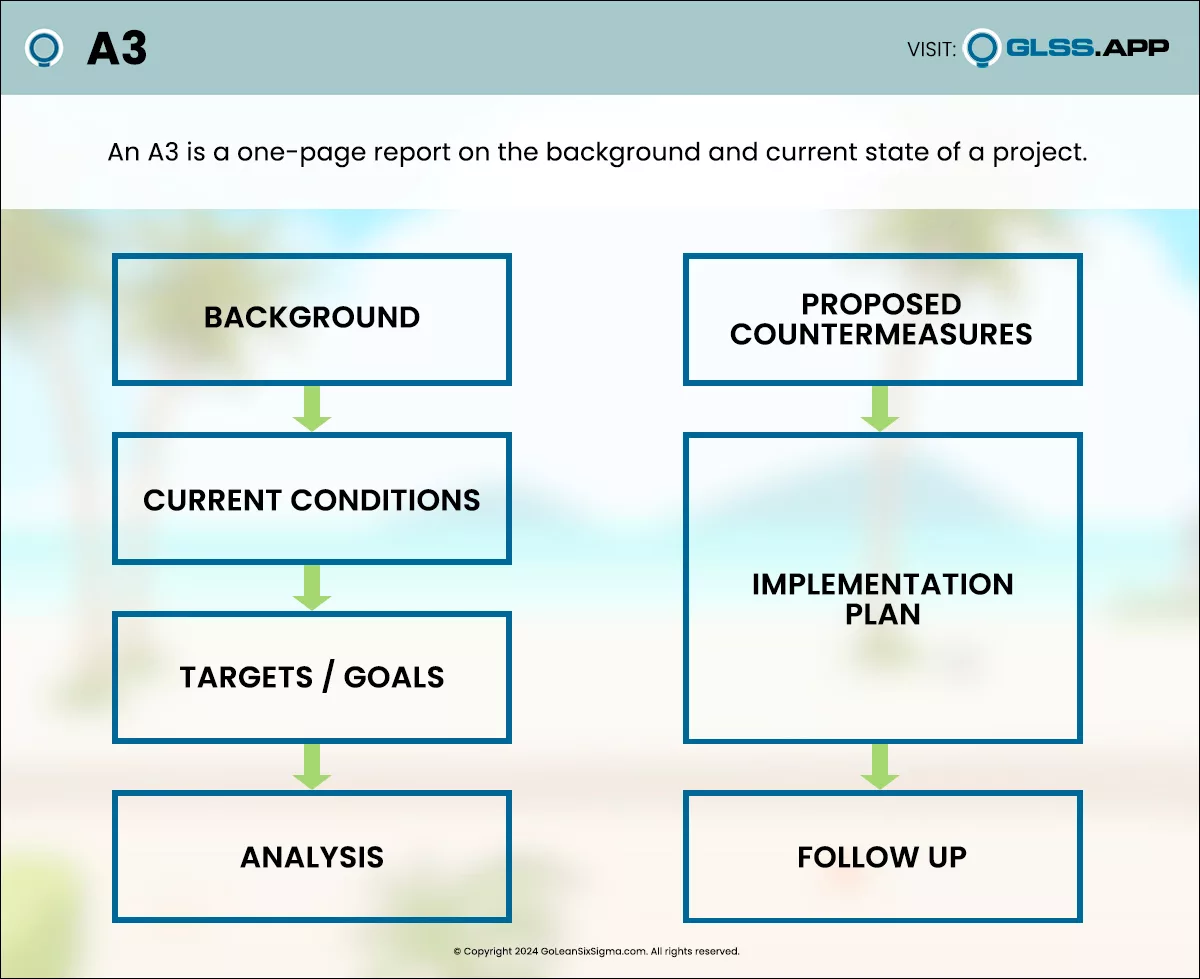
A Yellow Belt project is an important step in your Lean Six Sigma journey. Yellow Belt projects help people new to Lean Six Sigma start
In celebration of Filipino American History Month, a University of Hawaiʻi at Mānoa event “Entre-Pinoy-Ship” brought together a dynamic panel of Filipino-American entrepreneurs who shared
First, ensure that you’re in Admin view by clicking your initials in the top right corner, and selecting “Switch to Admin view”. In the top
For organizations with multiple teams, we’ll show you how to add an existing user to the team associated with your plan. First, ensure that
First, ensure that you’re in Admin view by clicking your initials in the top right corner and selecting “Switch to Admin view.” In the top
No post found.